Analysis of flow cytometry data is a time-consuming process, involving a manual step known as gating, where data collected for each sample is typically plotted as 2D graphs using 2 markers as axes to visually determine regions with a high density of observations. Observations from each individual gated region are extracted and new 2D plots are generated using other markers. The process is repeated iteratively until populations of interest are isolated, which is both time consuming and subjective. We have developed and applied a hierarchical density-based clustering algorithm which performs an exhaustive and unbiased identification of cell groups in flow cytometry datasets consisting of multiple samples.
What kind of analysis do we do
Methods:
- Quality control (QC)
- Filtering
- Unbiased clustering
- Population discovery
- Robust quantification
- CyTOF, FACS
- ICC (intraclass correlation coefficient)
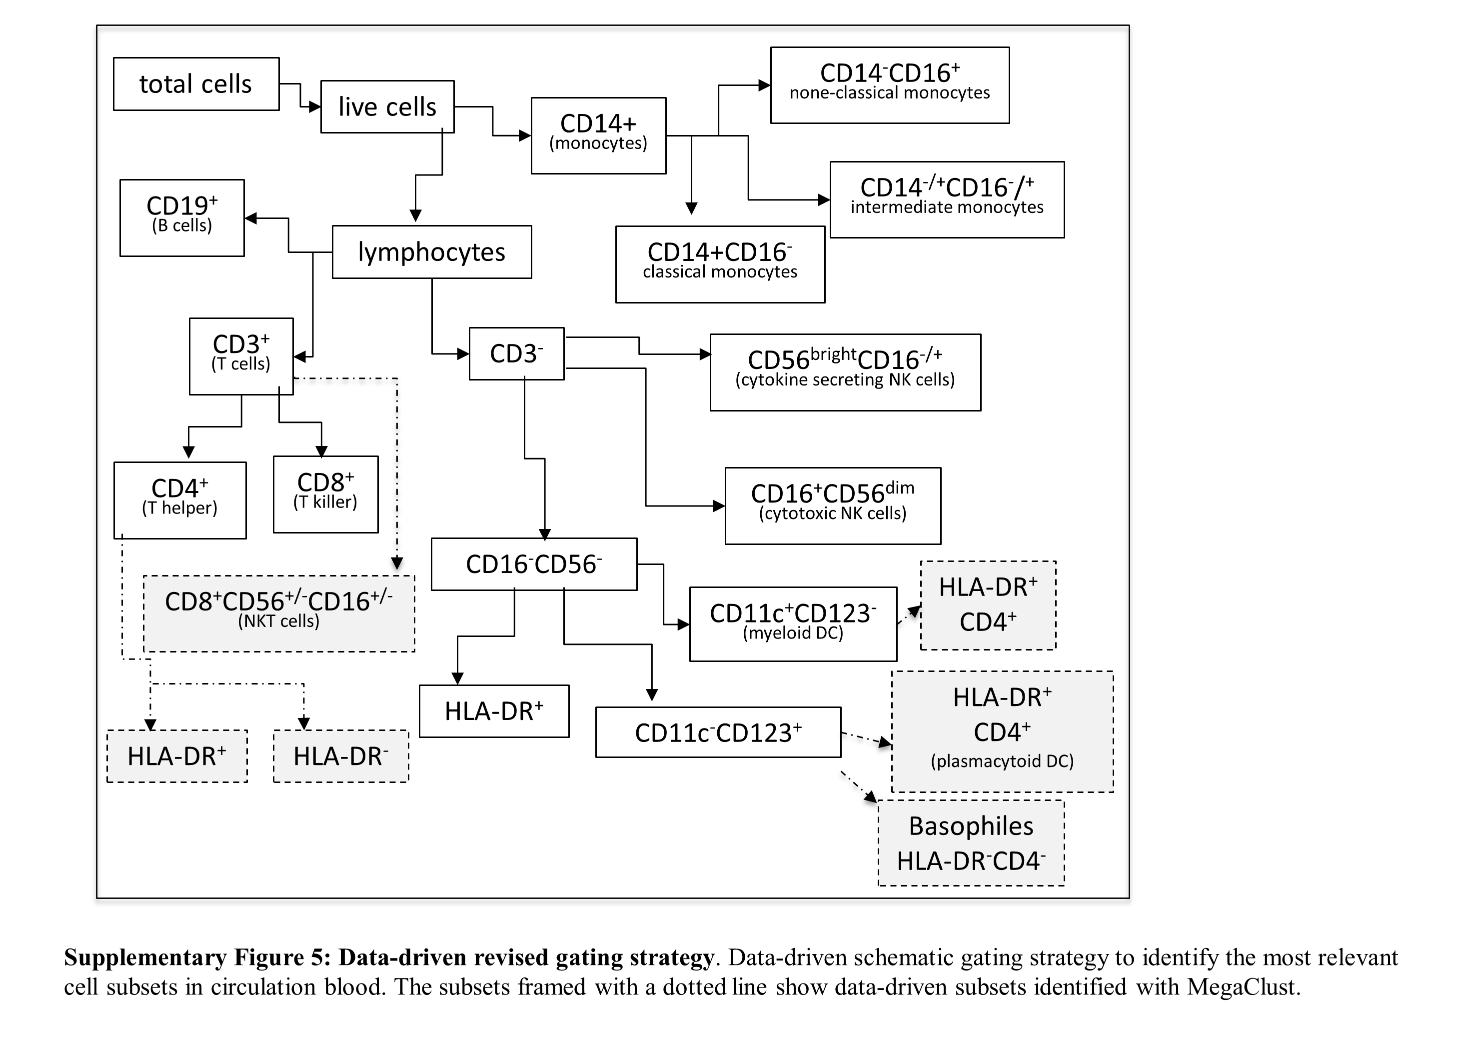
Unsupervised Analysis of Flow Cytometry Data in a Clinical Setting Captures Cell Diversity and Allows Population Discovery
In this publication, we went beyond the traditional gating approach using accepted protocols to identify immune populations and used clustering to discover populations that were not identified through gating. The existence of these rare cellular types was validated by cell sorting followed by RNAseq. As a result, an extended improved gating strategy (dotted boxes in the figure below) was proposed.